The Kalman filter: predict, correct, and get the likelihood for free
How the Kalman filter tracks the hidden state of a linear Gaussian state space model with a predict step and a correct step, and how the same pass gives forecasts, handles missing data, and computes the log-likelihood.
University lab From my coursework in the MSc in Statistics and Machine Learning at Linköping University, rewritten as a note to review later.
Once a time series is written as a linear Gaussian state space model, the question is: given the observations so far, what is the hidden state now? The Kalman filter answers it exactly, one time step at a time, by keeping a Gaussian belief (a mean and a covariance) and updating it with each new observation. I implemented it in a course lab, and what surprised me was how much one short loop gives you: state estimates, one-step predictions, long-range forecasts, missing-data handling and the likelihood.
The model
is the hidden state, the (here scalar) observation, known matrices, the state noise covariance and the observation noise variance. The start is .
Because everything is linear and Gaussian, the belief about stays Gaussian forever. So we only ever need to track a mean vector and a covariance matrix.
Two steps per time point
Notation: are the mean and covariance of given (the prediction). are the same given (the filtered estimate).
Predict (time update). Push the last belief through the dynamics:
The covariance grows: the old uncertainty is carried forward, and new noise is added.
Predict the observation. The predicted and its variance are
Correct (measurement update). Compare with the actual . The surprise is called the innovation. Then
is the Kalman gain. The way I think about it: it’s a ratio of “how unsure am I about the state” to “how unsure am I about the next observation”. If the state is very uncertain and the observation noise is small, is large and we move a lot toward the data. If the observation is noisy, is small and we mostly trust the prediction.
Missing data: just skip the correction
If is missing, there’s nothing to correct with. So set and and move on. That’s all. No imputation, no special model.
This also gives long-range forecasting for free. To forecast steps past the end of the training data, append missing values and run the filter. The “predictions” at those times are exactly the -step forecasts , and gives their variance. In the lab I did both training-time one-step predictions and validation forecasts with a single call this way.
The likelihood comes out of the same pass
By the chain rule, , and each factor is the Gaussian the filter already computed. So
This is called the prediction error decomposition. It’s what you maximize when learning the noise variances (see EM for state space models). Missing time points simply drop out of the sum. In my lab code I left out the constant term, which is fine for comparing parameter settings, but it means my numbers aren’t the full log-likelihood.
A compact implementation
import numpy as np

def kalman_filter(y, T, R, Q, Z, H, a1, P1):
    """Scalar observations; y may contain np.nan for missing values."""
    n, d = len(y), len(a1)
    a, P = a1.reshape(d, 1), P1.copy()
    y_pred, F, a_filt = np.zeros(n), np.zeros(n), np.zeros((n, d))
    loglik = 0.0
    for t in range(n):
        if t > 0:                                   # predict
            a = T @ a
            P = T @ P @ T.T + R @ Q @ R.T
        y_pred[t] = (Z @ a).item()
        F[t] = (Z @ P @ Z.T).item() + H
        if not np.isnan(y[t]):                      # correct
            v = y[t] - y_pred[t]
            K = P @ Z.T / F[t]
            a = a + K * v
            P = P - K @ Z @ P
            loglik += -0.5 * (np.log(2 * np.pi * F[t]) + v**2 / F[t])
        a_filt[t] = a.ravel()
    return y_pred, F, a_filt, loglik
What it looked like on the sea-level data
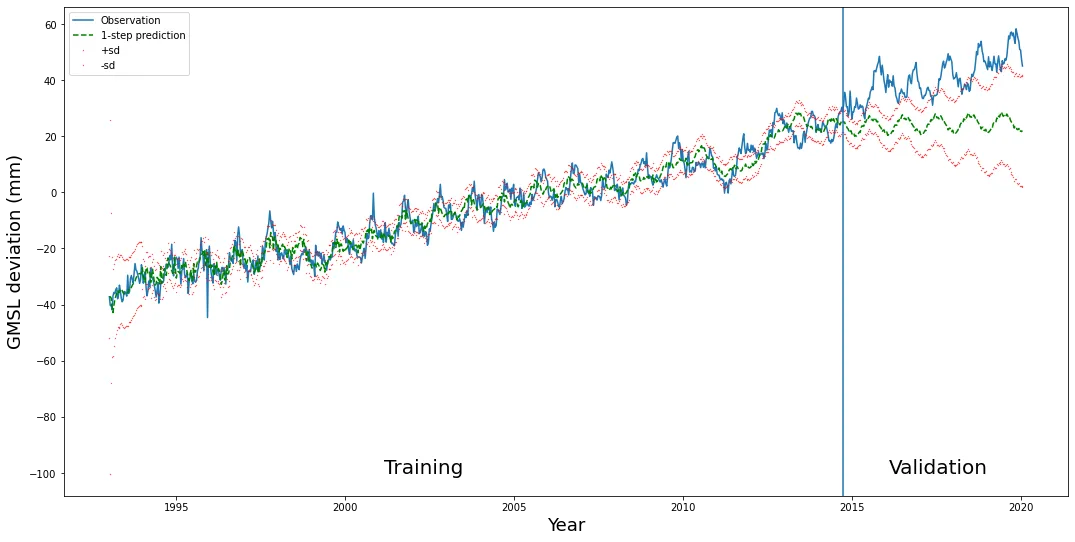
During training the one-step predictions follow the data closely with a narrow band. After the split, the forecast keeps the seasonal wiggle but the band widens steadily, because no new observations come in to shrink it. In my run the forecast trend came out too flat, and the data drifted above the forecast in the last years. A forecast of a local trend model extrapolates the slope at the end of training, so a dip just before the split can bend the whole forecast down. That’s worth remembering before trusting a long-range forecast.
Key takeaways
- The Kalman filter keeps a Gaussian belief (mean, covariance) about the hidden state and updates it in two steps: predict, then correct.
- The Kalman gain balances state uncertainty against observation noise.
- Missing observation: skip the correction. Forecasting: append missing values.
- The innovations and their variances give the exact log-likelihood.
- For offline analysis, the Kalman smoother adds a backward pass that uses later data too.
Resources
- 732A80 Time Series and Sequence Learning, Linköping University (course lab 2, autumn 2020).
- Durbin & Koopman, Time Series Analysis by State Space Methods, 2nd ed., Oxford University Press, 2012, Chapter 4 (filtering, missing observations, forecasting) and Section 7.2 (likelihood).
- Särkkä, Bayesian Filtering and Smoothing, Cambridge University Press, 2013, Chapter 4. https://users.aalto.fi/~ssarkka/pub/cup_book_online_20131111.pdf