Seismic wavelets: amplitude spectrum, phase spectrum and phase shifts
How a short seismic wavelet is built from sinusoids, and why a linear phase shift only moves it in time while a constant phase shift changes its shape.
A seismic source doesn’t send a single sine wave into the ground. It sends a short pulse, called a wavelet, and every reflection we record is a copy of that pulse. To process seismic data properly you need to understand the wavelet’s two spectra: amplitude and phase. I’ve rewritten this from my Persian notes from 2017. It’s about how the phase spectrum decides where a wavelet sits in time and what shape it has, and it builds on Waves and the Fourier spectrum.
A wavelet is a sum of sinusoids
The picture that helped me: imagine lots of springs, each bouncing with its own amplitude, frequency and phase. Add all their motions together. Where the sinusoids line up, they add up; everywhere else they cancel out. What you get is a signal that’s big for a short moment and almost zero outside it. That’s a wavelet.
A wavelet is transient: it has a start and an end, and its energy is finite and packed in between. (In seismic language, “wavelet” means this pulse. It’s related to, but not the same as, the wavelets of the wavelet transform.)
Building a wavelet from sinusoids is called synthesis, and it’s done with the inverse Fourier transform. Breaking a wavelet into its sinusoids is analysis, done with the forward Fourier transform. The two exactly undo each other, so nothing is lost either way. If is the wavelet in time and is its spectrum:
is complex, so we write it in polar form,
where is the amplitude spectrum and is the phase spectrum. A Fourier analysis gives you exactly these two curves.
Zero phase and linear phase
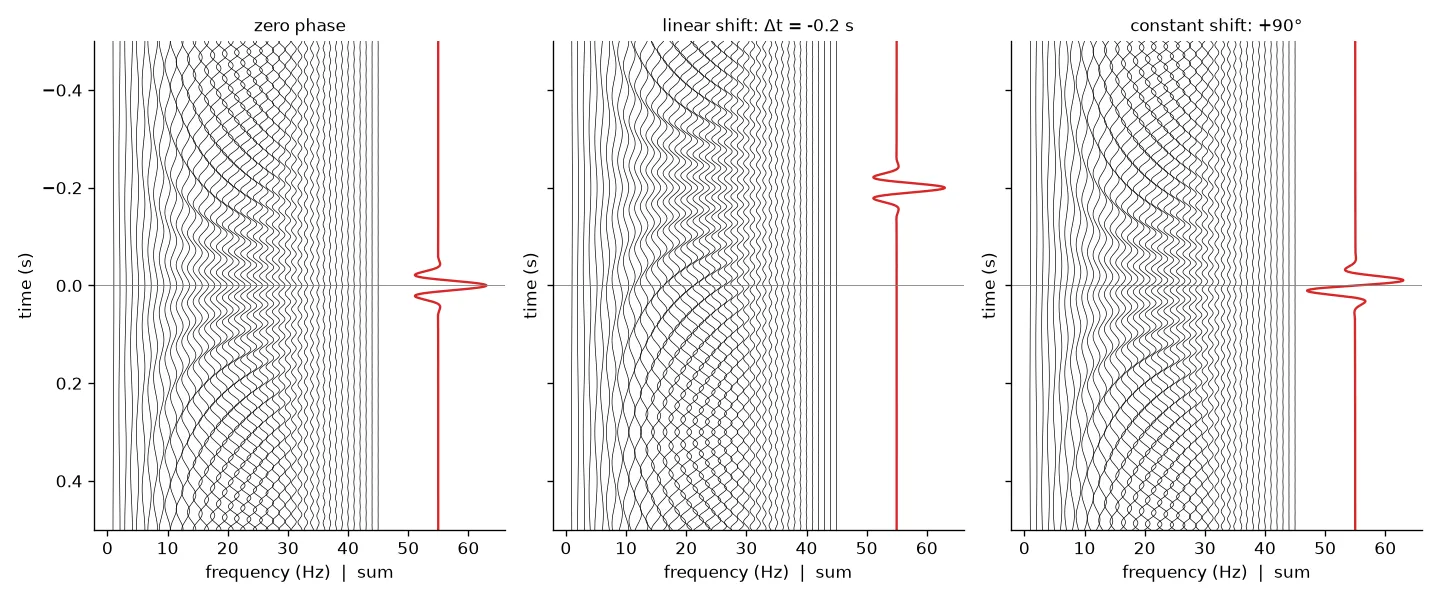
In the left panel every sinusoid has zero phase, so each one has a peak exactly at . They all add up there, and their sum is a sharp, symmetric wavelet with its biggest peak at . This is a zero-phase wavelet. Its energy is bunched at time zero.
A wavelet that’s symmetric around some other time is called linear phase, because its phase spectrum is a straight line through the origin. Zero phase is just the special case where that line is flat (). A wavelet without this kind of symmetry has non-linear phase.
Linear phase shift: sliding the wavelet in time
Go back to the cosine . There are two ways to change its phase: change the time part, or change the phase constant .
First, slide the whole wavelet by seconds. Every frequency component moves by the same . For a component with frequency , a delay of is a fraction of its period, so its phase lag is . Phase is minus the phase lag, so the new phase spectrum is
The extra term is a straight line in with slope . That’s why it’s called a linear phase shift. The key point for me was that the same time shift means a bigger phase change for higher frequencies. In the middle panel above, s (a shift to earlier time), so each component gains of phase. Moving the wavelet earlier reduces its delay, so its phase goes up.
What changes and what doesn’t:
- The amplitude spectrum doesn’t change.
- The wavelet’s shape and symmetry don’t change. Only its centre moves.
- The phase spectrum stays a straight line. Only its slope changes: a shift to earlier time tilts it up, a shift to later time tilts it down.
Constant phase shift: changing the wavelet’s shape
Now leave time alone and add the same angle to every component. The right panel above shows a shift. The sinusoids are no longer symmetric around , and their sum is a different, antisymmetric wavelet, even though its amplitude spectrum is exactly the same as the zero-phase one. In the spring picture, it’s like changing the starting angle of every spring by the same amount.
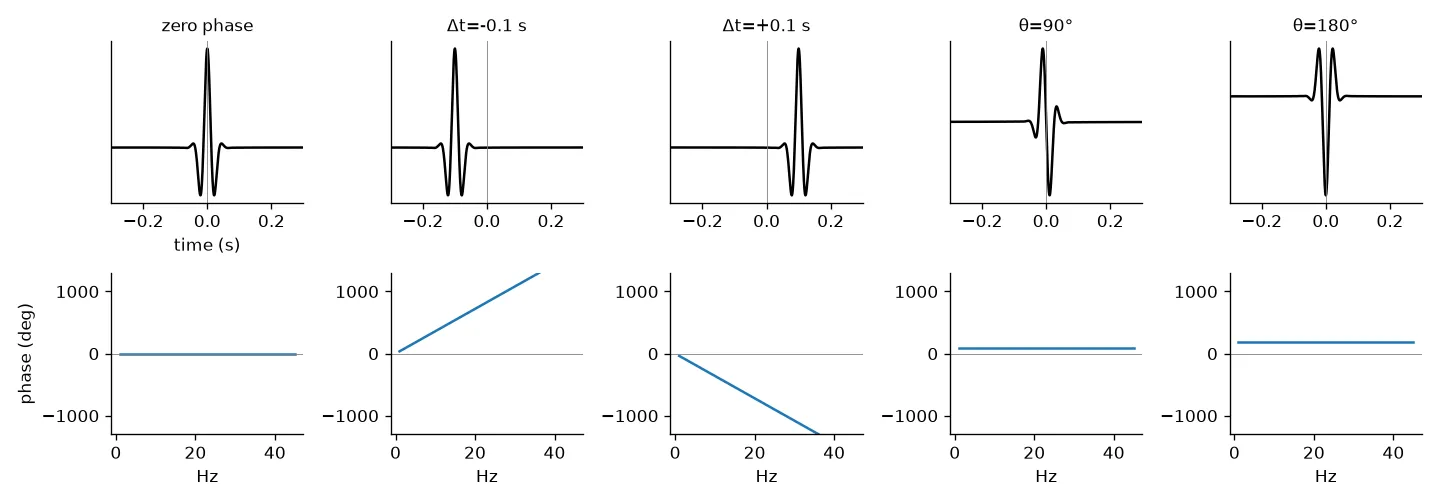
As the constant shift grows:
- breaks the symmetry of the zero-phase wavelet.
- flips the polarity (the wavelet turns upside down).
- changes both symmetry and polarity.
- gets you back to the original wavelet.
Again, the amplitude spectrum doesn’t change. Only the shape does.
Both shifts together
In general a phase change has both parts:
where is the constant shift and is the slope from a time shift. Applying a constant shift and a s linear shift to a zero-phase wavelet gives an antisymmetric wavelet centred at s.
import numpy as np

fs, n = 1000, 1000
t = (np.arange(n) - n//2) / fs                   # time axis centred on 0
f = np.fft.fftfreq(n, 1/fs)
A = np.exp(-((np.abs(f) - 20) / 12)**2)          # smooth band around 20 Hz
A[0] = 0                                         # no DC component

def wavelet(theta_deg=0.0, dt=0.0):
    # phase = constant shift (odd in f, so the result stays real) + linear shift
    phi = np.sign(f) * np.radians(theta_deg) - 2*np.pi*f*dt
    s = np.fft.ifft(A * np.exp(1j*phi)).real
    return np.fft.fftshift(s)                    # put t = 0 in the middle

w0 = wavelet()                  # zero phase, peak at t = 0
w1 = wavelet(dt=-0.2)           # same shape, peak at t = -0.2 s
w2 = wavelet(theta_deg=180)     # polarity reversed
print(t[w0.argmax()], t[w1.argmax()], np.allclose(w2, -w0))
This prints 0.0 -0.2 True. One detail that tripped me up: the np.sign(f) factor. For a real signal the phase spectrum has to be odd (), so a constant shift of at positive frequencies comes with at negative ones.
Key takeaways
- A seismic wavelet is a short pulse with finite energy, made by adding lots of sinusoids. The Fourier transform splits it into an amplitude spectrum and a phase spectrum .
- In a zero-phase wavelet all components peak together at , so the energy is bunched there.
- A time shift adds to the phase: the wavelet moves but keeps its shape.
- A constant phase shift keeps the wavelet in place but changes its shape. flips the polarity.
- Neither kind of phase shift changes the amplitude spectrum.
The next step, minimum vs. maximum phase and why bandwidth sets resolution, is in Minimum, maximum and mixed phase wavelets.
Resources
- Öz Yilmaz, Seismic Data Processing, SEG Investigations in Geophysics No. 2, 1987, Chapter 1 (the sinusoid-to-wavelet, linear phase shift and constant phase shift examples that inspired the figures here). The 2001 edition, Seismic Data Analysis, is free on the SEG Wiki: https://wiki.seg.org/wiki/Seismic_Data_Analysis.