2005 – 2019 · Work
Seismic Data Acquisition QC Supervisor, junior to senior
National Iranian South Oil Company (NISOC) ↗ · Khuzestan, Iran
Fourteen years in the oil fields of south-west Iran, making sure seismic surveys recorded clean, trustworthy data. I started as a junior QC geophysicist and left as a senior supervisor, and most of my habits around data come from here.
From a shot to a picture
How a seismic survey works, step by step
- 1
The shot
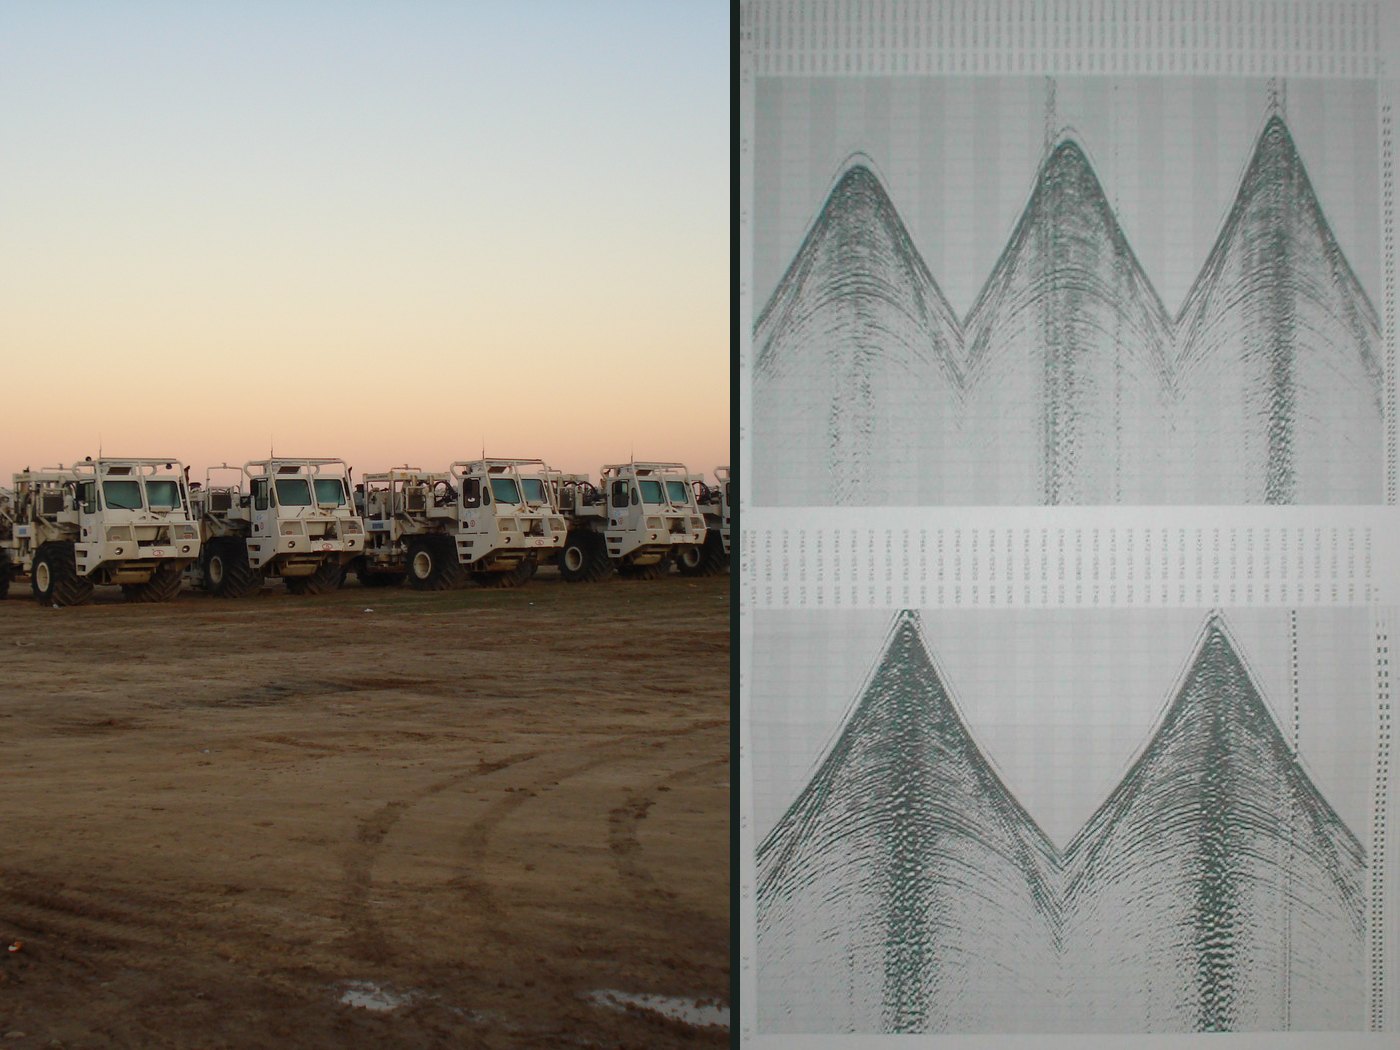
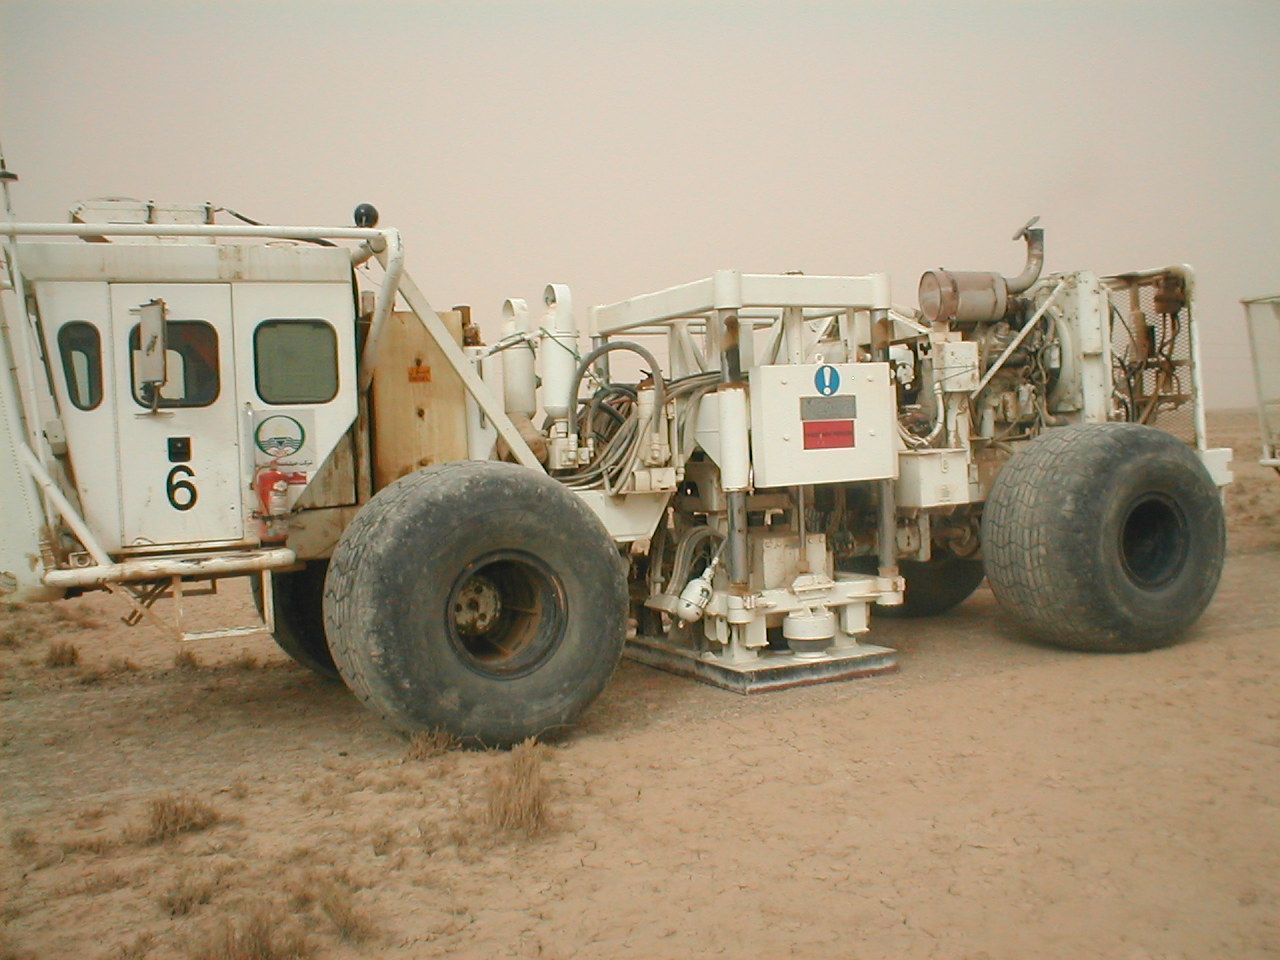
Everything starts with a controlled pulse of energy. Vibroseis trucks press a heavy plate onto the ground and shake it with a sweep of frequencies for several seconds. In rough terrain we used small dynamite charges in shallow holes instead.
- 2
Waves go down
The energy spreads into the ground as a wavefront, like ripples from a stone dropped in a pond, only in three dimensions. It speeds up or slows down in each rock layer it passes through.
- 3
Echoes come back
At every boundary between two kinds of rock, part of the energy bounces back up. The bigger the difference between the rocks, the stronger the echo. The rest keeps going down to deeper layers.
- 4
Geophones listen
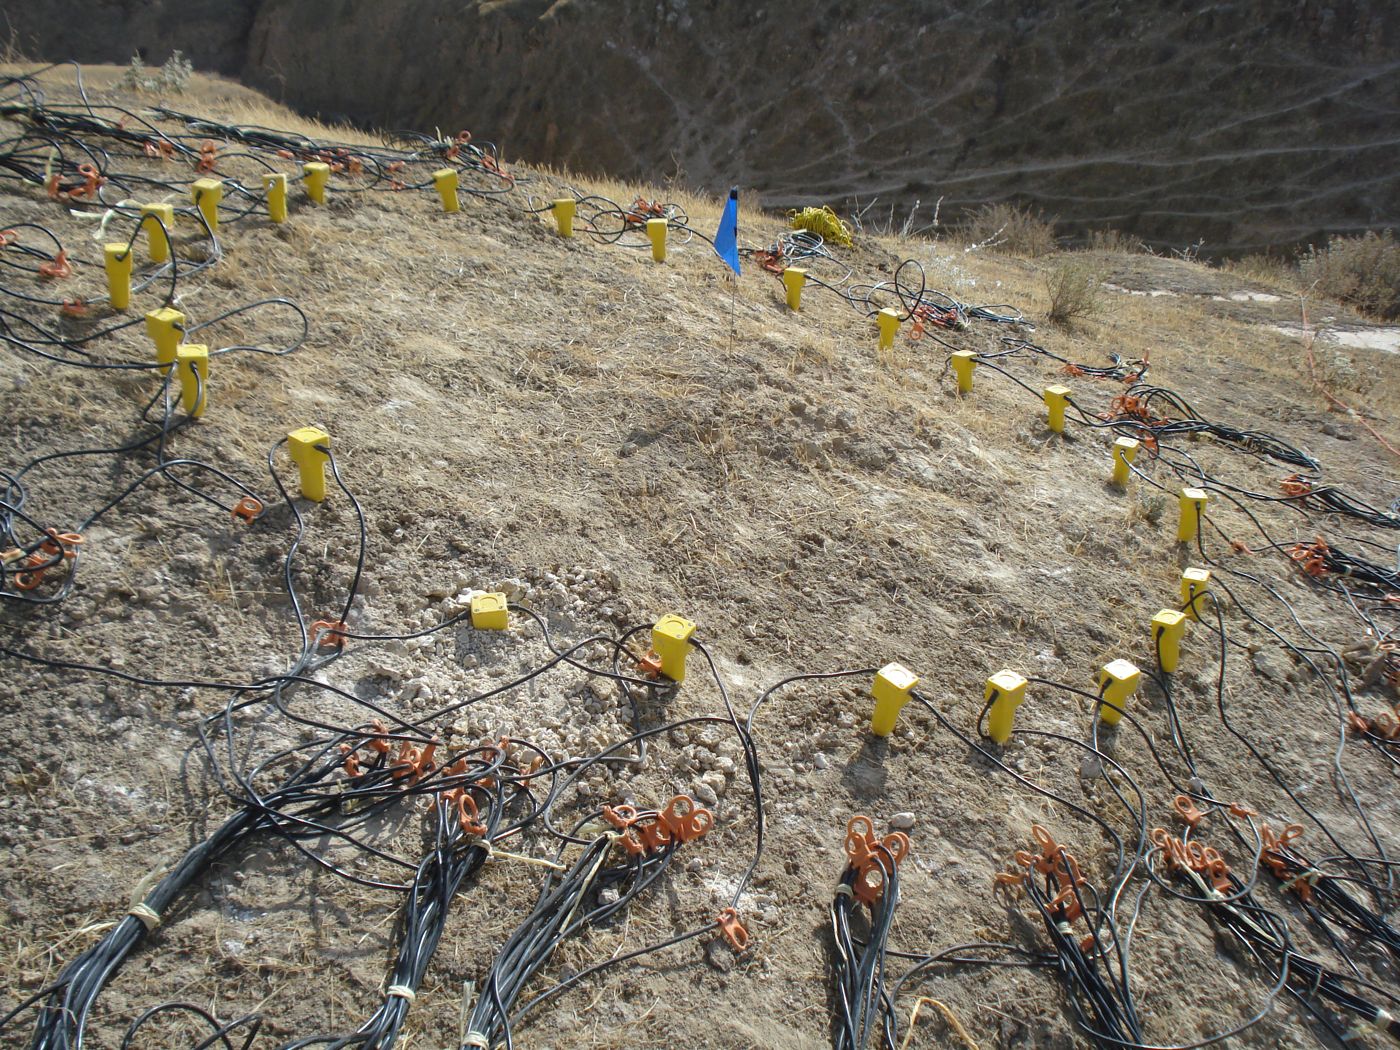
Thousands of small sensors called geophones are planted in lines on the surface. They turn tiny movements of the ground into electrical signals. Every spot on the line becomes one recording, called a trace.
- 5
The recording truck
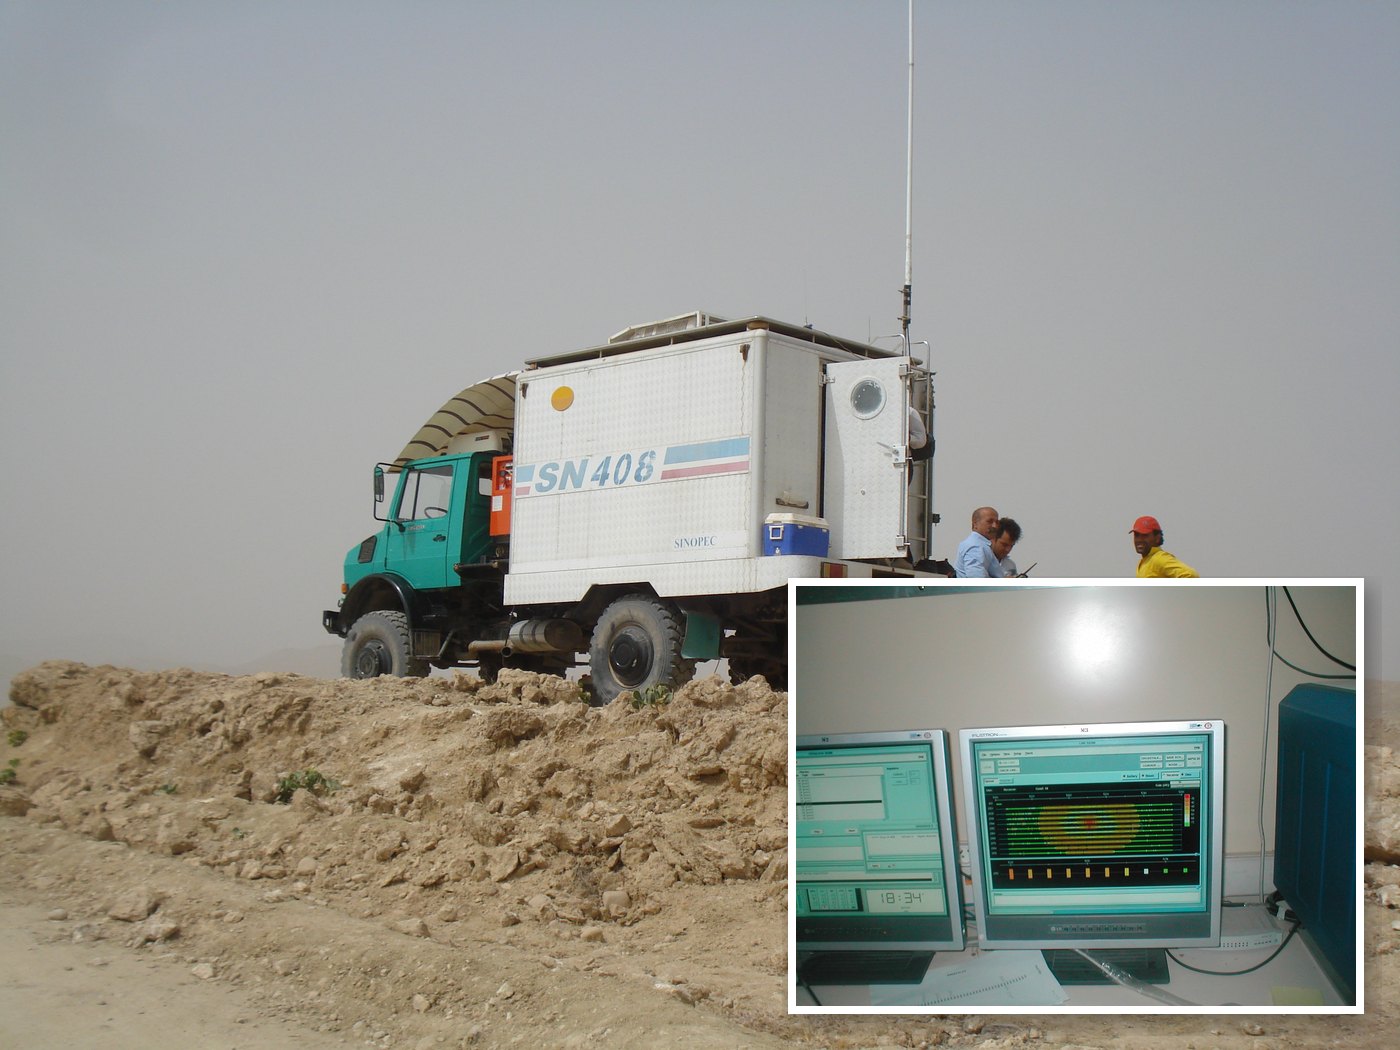
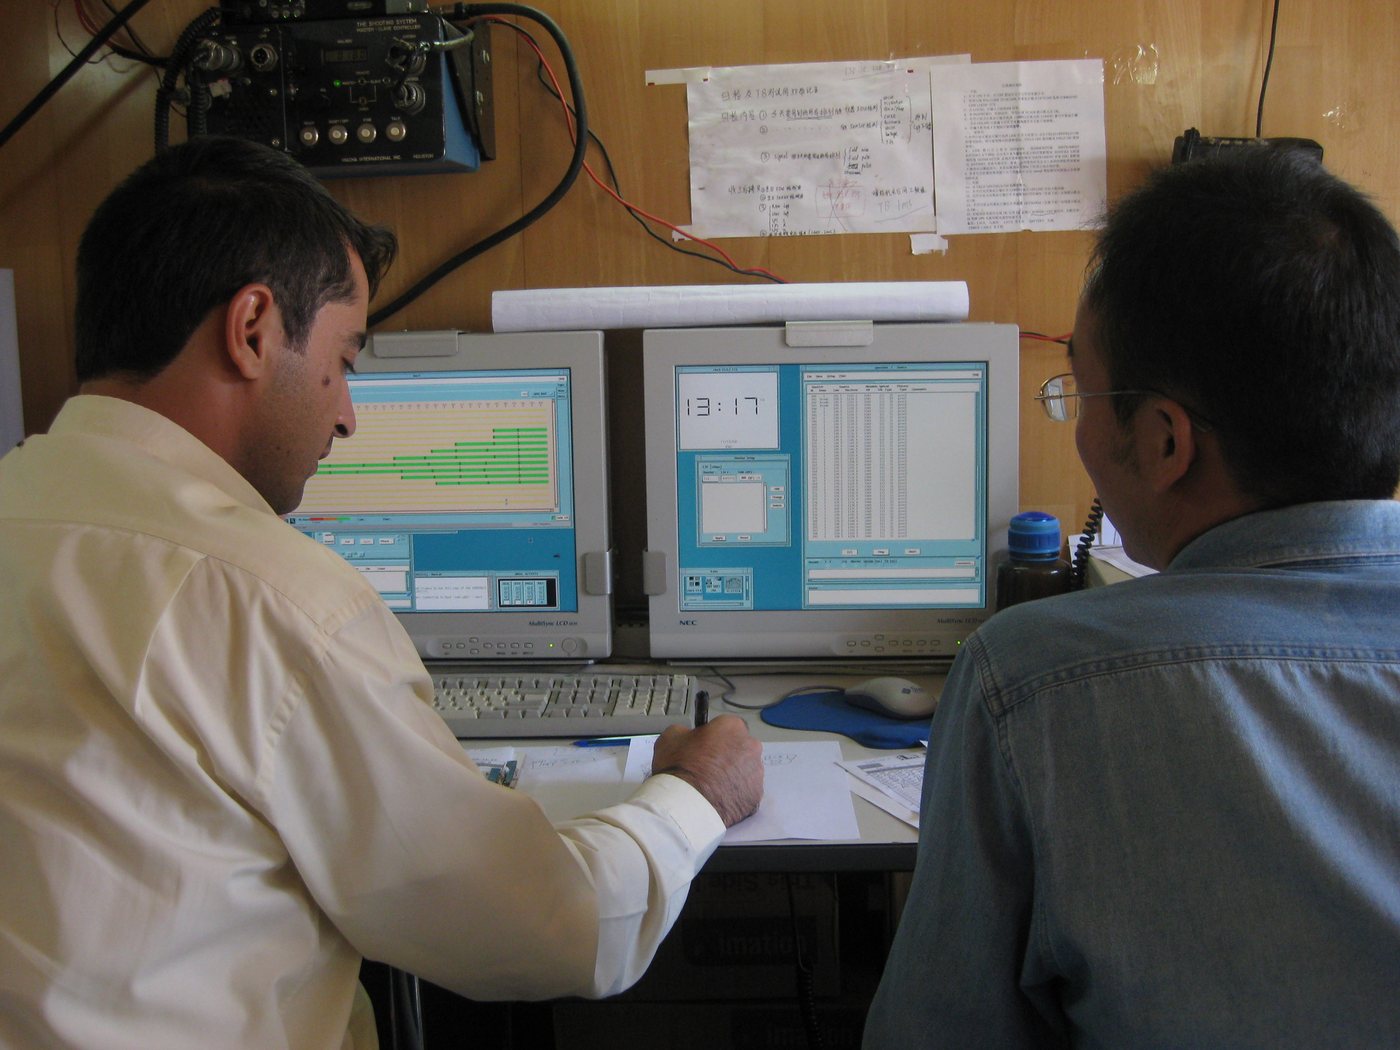
Cables carry every signal to the recording truck. This is where QC happens: we checked each shot live on the monitors, looking for dead channels, noise and wrong positions, before the crew moved on to the next shot.
- 6
A shot gather
Put all the traces from one shot side by side and you get a shot gather. Each echo shows up as a curve. Geophones far from the shot hear the echo later because the path is longer, so the curve bends down at the edges.
- 7
Flatten and stack
Later, in processing, traces from many shots that look at the same point underground are grouped. Each curve is flattened, which is called normal moveout correction, and then the traces are added up. Random noise cancels out while the echoes add up. Repeat that along the line and you get the first picture of the layers underground.
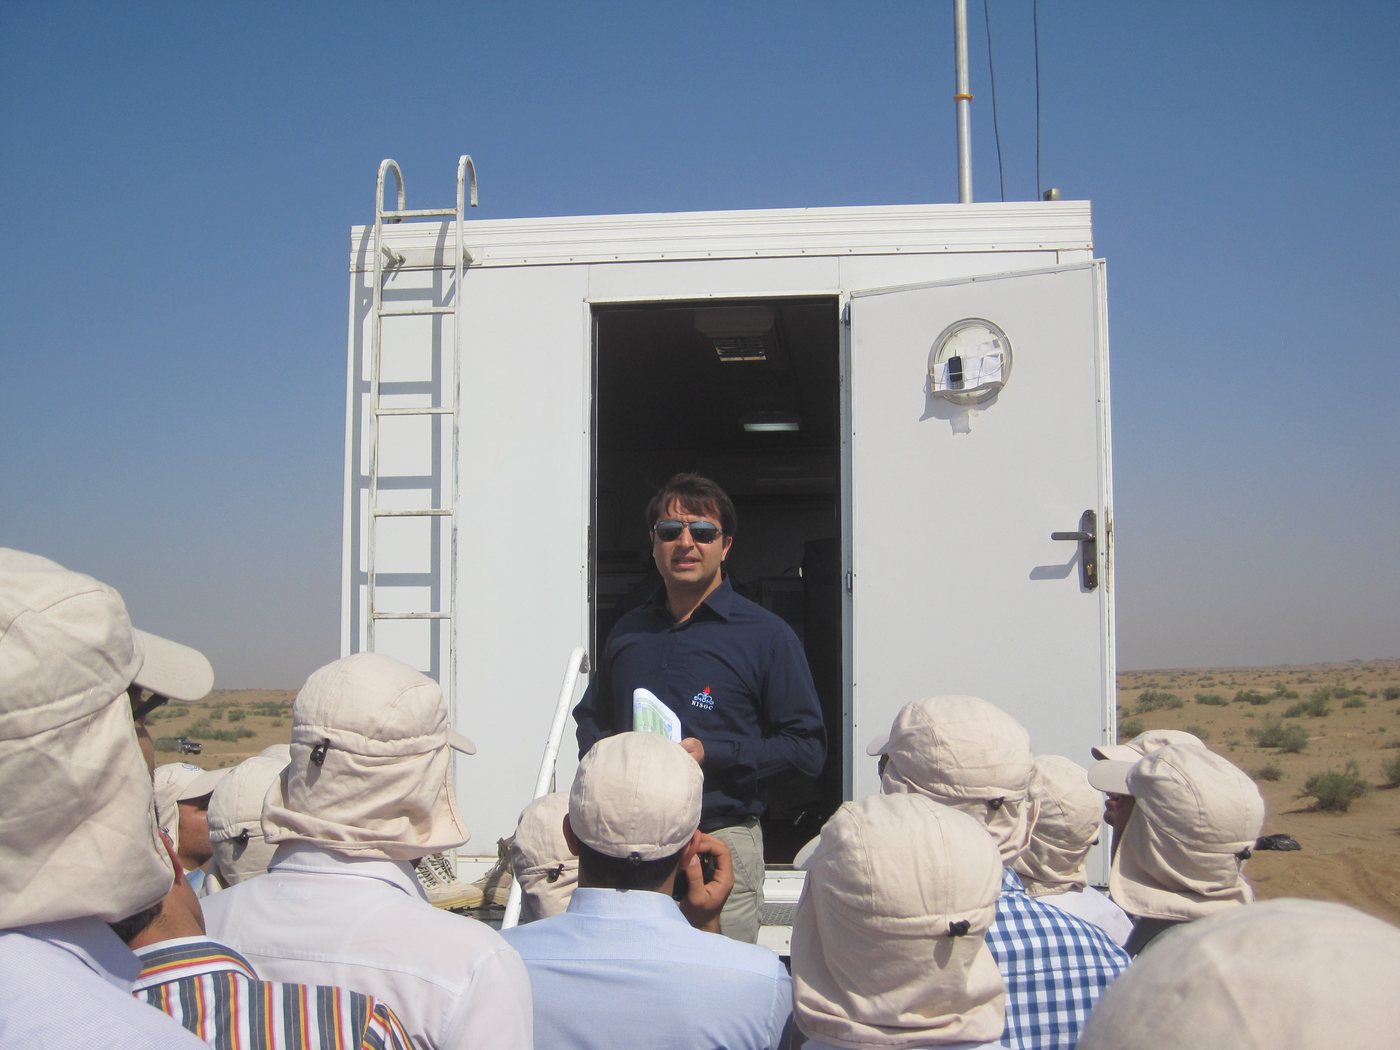
The cross-section and traces are a drawing, not real data. The photos are mine, from the field.
What quality control means here
A survey is only worth something if the data is clean and every recording is where it's supposed to be. If a problem slips through, it shows up months later as a blurry or wrong image, and by then the crew is gone.
So QC is checking, every day: is the source working properly, are the sensors all alive and wired the right way, are the positions right, is noise under control, and are the field procedures and safety rules followed. When something is wrong, you decide on the spot whether to fix it or record again.
What I did
- Quality control of 2D and 3D land seismic surveys in deserts, sand dunes and folded mountains: recording quality, survey geometry and field procedures.
- Supervised acquisition in more than five oil fields, with both dynamite and vibroseis sources.
- Reviewed survey designs and field data before they went to processing.
- Wrote technical reports on survey-design scouting, receiver-array design, recording in a busy industrial city area, and safe distances for blasting near buildings.
- Mentored new and junior geophysicists, and advised an MSc student on her thesis.
- Was recognised as one of the company's best seismic acquisition supervisors in 2015.
What carried over into computer vision
More than I expected. Waves, spectra, filtering and noise are the same ideas whether the signal is a seismic trace or an image. Checking data before trusting it is most of the work in training data too. And survey layouts, coordinates and terrain turned into orthomosaics, map projections and GIS.
Publications from the field years (in Persian)
- Applying the asymmetrical extended-patch method to improve data quality in a 3D seismic acquisition projectKimassi, Mansuri, Pirmoradiyan. Journal of Exploration & Production Oil & Gas, No. 143, 2017.
- Optimising a 3D seismic survey design to acquire high-quality dataKimassi, Paryab, Pirmoradiyan, Puladzadeh. NISOC Journal of Knowledge Management, 2016.
- The origin of noise events in surface seismic data and how to reduce themPirmoradiyan, Tayyebi. NISOC Journal of Knowledge Management, 2016.
Training courses during the job
Professional courses I completed while working at NISOC.
Survey design
- Advanced 2D–3D design for land seismic operations and parameter design
- Fundamentals of 3D seismic survey design
- 3D seismic survey design with OMNI Workshop 5.0
Processing and interpretation
- Seismic data processing
- Advanced seismic data processing
- Advanced seismic data interpretation
- Vertical seismic profiling: tools, design, processing and interpretation